How to Plot Scatter Diagram in Excel? | Guides with example | Interpretation
How to Plot Scatter Diagram in Excel |Guides with example | Interpretation:
Hi reader! Today we will discuss on How to Plot Scatter Diagram in Excel? The scatter diagram is a type of tool that is generally used to know the correlation between two variables. We have published a separate post on the concept of scatter diagrams with industrial examples and interpretation of results, if you are interested in knowing the concept before reading this article then you may read more, the link is provided below.
Scatter Diagram Template |Industrial Example |Download Excel Format.
How to Plot Scatter Diagram in Excel?
We would like to explain it with examples.
Example:
A class teacher tried to survey their top five students’ marks obtained in % v/s study hours. Details of the data are given below.
| Variable-1 | Variable-2 |
| Study hours | Mark obtained in % |
| 5 | 40 |
| 6 | 50 |
| 7 | 65 |
| 8 | 82 |
| 10 | 89 |
Now class teacher has drawn the scatter diagram to know the correlation between variables. Step by step guide is mentioned below;
Step-1:
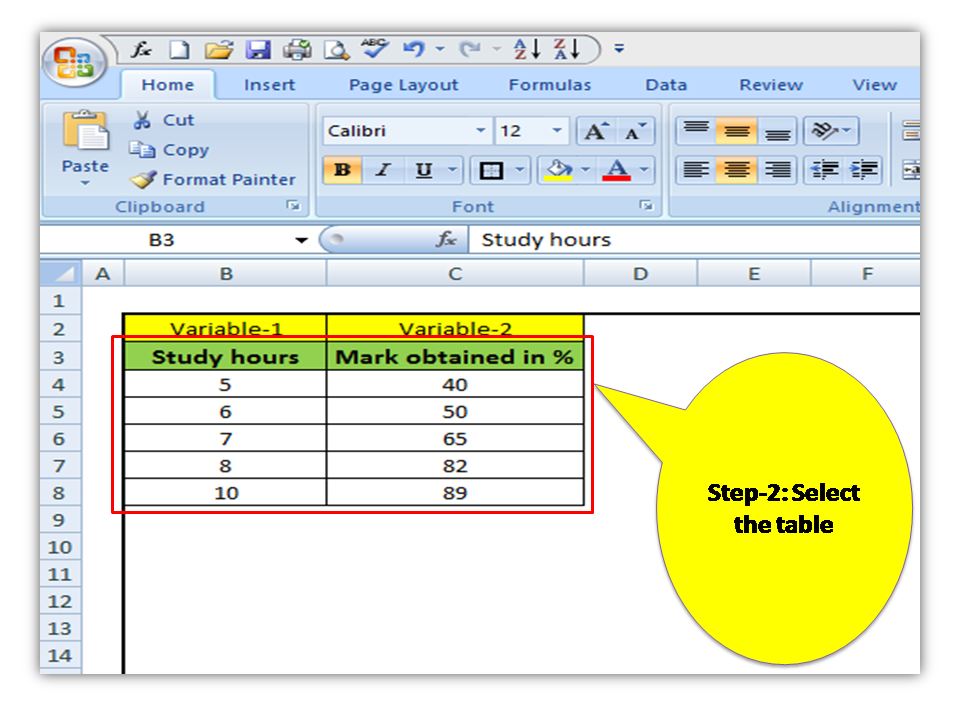
Open the excel sheet and make a table.

Step-2:
Select the table to plot the diagram.

Step-3:
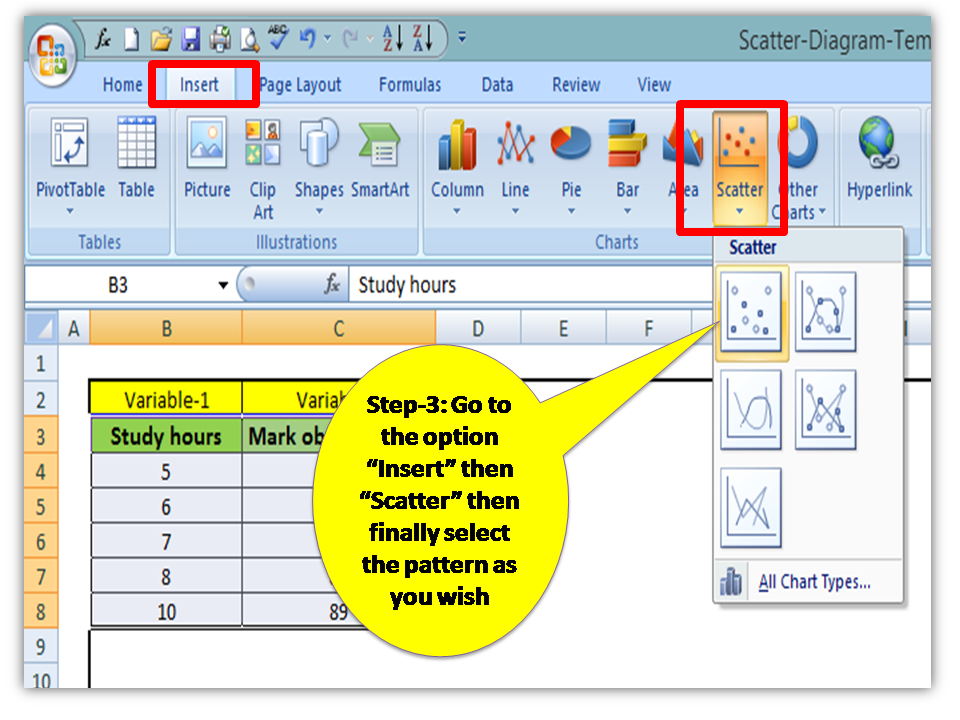
Choose the pattern of the Scatter diagram as you wish, To do so first go to the option “Insert” and then select the scatter diagram option with your preferred pattern. Details are mentioned in the below figure.

Step-4:
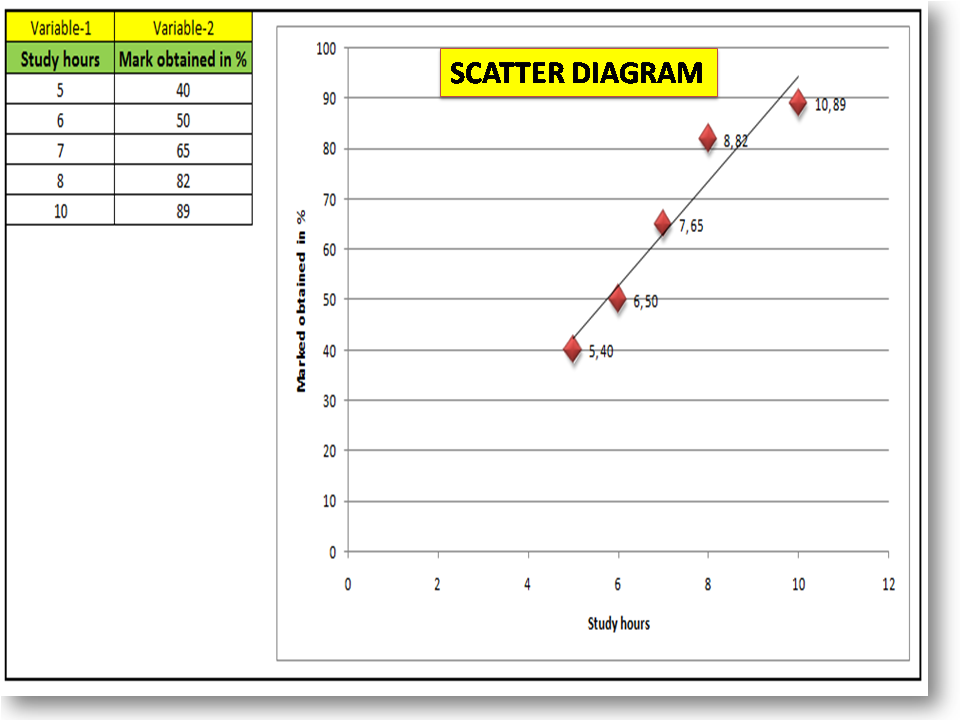
Now, your Scatter Diagram is ready.

Interpretation of the above scatter diagram:
All sample points are nearer to the trend line and in a positive direction. So the scatter diagram indicates us there is a perfect positive correlation between two variables. Read more…to know more about common possibilities of correlation.
Free Templates / Formats of QM: we have published some free templates or formats related to Quality Management with manufacturing / industrial practical examples for better understanding and learning. if you have not yet read these free template articles/posts then, you could visit our “Template/Format” section. Thanks for reading…keep visiting techiequality.com
Popular Post


