How to calculate effective Production Sequencing?
How to calculate effective Production Sequencing?
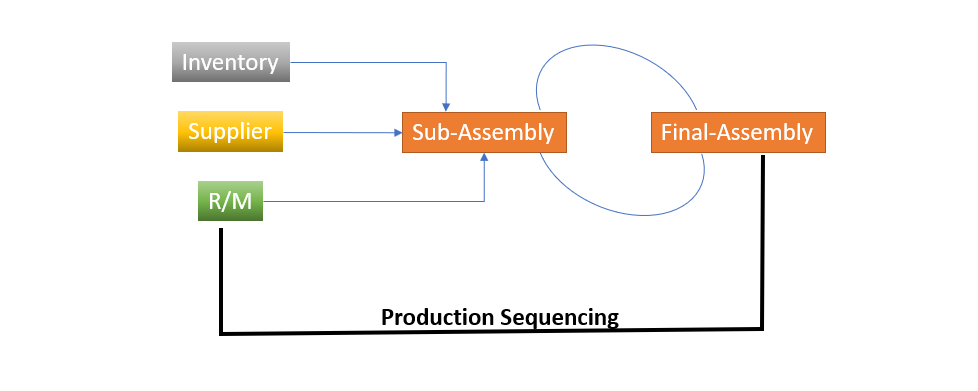
Hi readers! Today we will be discussing on how to calculate effective production sequencing. Production sequencing is the most important part of PPC (Production planning and control). Its helps to meet the on-time customer delivery and enhance customer satisfaction and the Brand name.
Before doing the production sequencing, at least prioritize and consider some factors like processing time, due date, delivery time, flow time minimization, work-in-process inventory minimization, idle time of machines minimization, etc. for effective sequencing. And another important part is the methods of priority for production sequencing like [1] FCFS ( First come first served), [2] SOT ( Shortest operating time), [3] STR (Slack time remaining), [4] EDD (Earliest due date), [5] STROP (Slack time remaining per operation), [6] CR (Critical Ratio), [7] LCFS (Last- come first served).
Understanding of Several Methods:
- First come first served: Production is run w.r.t first arriving in the department, let’s say the first week of the month the “X” customer has ordered 5nos and 10nos of product-1 and product-2 for supply within the next two weeks. And later the same customer ordered product-3 in the second week of the same month and they need product supply at the end of the second week. Now the important thing is how to apply FCFS methods to select the product sequence means with the product need to be started first for manufacturing. Details of the calculation have discussed below example.
- Shortest operating time: Manufacturing the product with the shortest processing time means the shortest completion time.
- Slack time remaining: Time remaining before the due date remaining completion time.
- EDD (Earliest due date): Produce the product with the earliest due date first.
Step by step calculation of effective Production Sequencing with manufacturing example:
Here, we are going to calculate the production sequencing with the different scenarios by applying multiple methods.
Manufacturing Example:
Suppose a company namely XYZ Pvt. Ltd has got an order of 6 types of product, details of orders are given below.
| Product Name | Delivery Days | Processing Time (Days) |
| A-Prod | 6 | 4 |
| B-Prod | 7 | 5 |
| C-Prod | 8 | 3 |
| D-Prod | 9 | 7 |
| E-Prod | 3 | 2 |
| F-Prod | 2 | 1 |
After getting the orders, the production supervisor has applied several methods like [1] FCFS ( First come first served), [2] SOT ( Shortest operating time), [3] STR (Slack time remaining), [4] EDD (Earliest due date), [5] STROP (Slack time remaining per operation), [6] CR (Critical), [7] LCFS (Last- come first served) and selected the effective production sequence among all the methods.
First, he has applied the FCFS (First-Come First Served) Method. All the above products (Prod-1 to Prod-6) are completed in a single machine.
Methods-1 (FCFS):
| Product Name | Processing Time (Days) | Delivery Days | Flow Time in Days | On-time or late delivery in days |
| A-Prod | 4 | 6 | 4 | On-time |
| B-Prod | 5 | 7 | 4+5=9 | Late=2 |
| C-Prod | 3 | 8 | 4+5+3=12 | Late=4 |
| D-Prod | 7 | 9 | 4+5+3+7=19 | Late=10 |
| E-Prod | 2 | 3 | 4+5+3+7+2=21 | Late=18 |
| F-Prod | 1 | 2 | 4+5+3+7+2+1=22 | Late=20 |
According to the FCFS method, the supervisor has calculated the sequence, on-time, and late delivery time in days. As we can see that only A-prod can deliver on time. and the rest 5 products will be late by 2,4,10,18,20 days. On average a job will be late by 9 days.
Method-2-SOT (Shortest operating time):
| Product Name | Delivery Days | Processing Time (Days) | Flow Time in Days | On time or late delivery in days |
| F-Prod | 2 | 1 | 1 | On time |
| E-Prod | 3 | 2 | 1+2=3 | On time |
| C-Prod | 8 | 3 | 1+2+3=6 | On time |
| A-Prod | 6 | 4 | 1+2+3+4=10 | Late=4 |
| B-Prod | 7 | 5 | 1+2+3+4+5=15 | Late=8 |
| D-Prod | 9 | 7 | 1+2+3+4+5+7=22 | Late=13 |
The above data indicates that 3 products will be on time. and the rest three products will be late by 4,8 and 13 days. On average, a product will be late by 4.17 days (4+8+13 /5).
Method-3- EDD (Earliest due date):
| Product Name | Delivery Days | Processing Time (Days) | Flow Time in Days | On-time or late delivery in days |
| F-Prod | 2 | 1 | 1 | On-time |
| E-Prod | 3 | 2 | 1+2=3 | On-time |
| A-Prod | 6 | 4 | 1+2+4=7 | Late=3days |
| B-Prod | 7 | 5 | 1+2+4+5=12 | Late=7days |
| C-Prod | 8 | 3 | 1+2+4+5+3=15 | Late=12days |
| D-Prod | 9 | 7 | 1+2+4+5+3+7=22 | Late=15days |
After applying the method-3, you can see that only 2 products i.e. “F-Prod”, “E-Prod” will be on-time. And rest 4 products will be late. But on an average a product will be late by 6.16days.
Conclusion:
Here, we will compare the above three methods and will find the best among them and accordingly the schedule will be decided.
| Methods | Flow Time in Days (total) | Average Lateness in days | On-time delivery(total) |
| First come first served | 87 days | 9 days | 1 number |
| Shortest operating time | 57 days | 4.17 days | 3 number |
| Earliest due date | 60 days | 6.16 days | 2 number |
According to the above comparison of three methods, the shortest operating time method result is the best one compared to the other two methods. In this way, you can select the best and most effective production sequencing.
As per the SOT (Shortest operating time) method, First, you have to start production of “F-Prod” and then. need to follow the below sequence as;
| Product Name | Production Sequence |
| F-Prod | 1st |
| E-Prod | 2nd |
| C-Prod | 3rd |
| A-Prod | 4th |
| B-Prod | 5th |
| D-Prod | 6th |
Free Templates / Formats of QM: we have published some free templates or formats related to Quality Management with manufacturing / industrial practical examples for better understanding and learning. if you have not yet read these free template articles/posts then, you could visit our “Template/Format” section. Thanks for reading…keep visiting techiequality.com
Popular Post:
Related Posts
5 Whys Excel Template , Download why why analysis excel format

Dispersion Analysis Cause & Effect Diagram Template |Download Excel Format

Run Chart Example | Concept & Interpretation of Result with Case Study | Industrial Example:
About Author
TECHIEQUALITY
The Author is an Expert in Quality Management System, Operation Management, Business Excellence, Process Excellence, IATF 16949, ISO 9001, ISO 14001, ISO 45001, ISO 17025, TQM, TPM & QA. He is Certified as an IA for ISO 9001, IATF 16949, ISO 14001, ISO 17025 & ISO 45001 Standard.
