Process Performance Example (Pp) & Ppk |Download Format
Process Performance Example (Pp) & Ppk |Download Format
Hello Readers! Today we will discuss and measure the process performance (Pp) and its index (Ppk) with industrial examples. If you are interested in gaining basic knowledge about Process Performance, then go through the below link and also on this platform you can download the Excel templates or formats. details have been illustrated with a Process Performance Example.
DOWNLOAD EXCEL TEMPLATE (Pp & Ppk and many more.)
Example-1:
We are having 100 numbers of readings of Total clay of green sand used in the metal manufacturing industry. Details of the reading are given below;
| Sl.No. | 1 | 2 | 3 | 4 | 5 | 6 | 7 | 8 | 9 | 10 |
| Subgroup1 | 12.50 | 12.70 | 12.80 | 12.90 | 12.80 | 12.90 | 12.80 | 13.00 | 12.90 | 12.70 |
| Subgroup2 | 12.50 | 12.90 | 12.90 | 12.90 | 12.80 | 12.90 | 12.70 | 13.10 | 12.90 | 12.90 |
| Subgroup3 | 12.50 | 12.80 | 12.50 | 12.90 | 12.90 | 12.80 | 12.90 | 12.90 | 12.90 | 12.80 |
| Subgroup4 | 12.80 | 12.80 | 12.80 | 13.10 | 12.90 | 12.80 | 12.80 | 12.80 | 13.10 | 12.80 |
| Subgroup5 | 12.60 | 12.80 | 12.70 | 13.00 | 12.70 | 12.70 | 12.80 | 12.80 | 13.00 | 12.80 |
| 11 | 12 | 13 | 14 | 15 | 16 | 17 | 18 | 19 | 20 |
| 12.80 | 13.00 | 12.70 | 12.90 | 12.80 | 12.70 | 12.90 | 12.80 | 13.00 | 12.70 |
| 12.80 | 13.10 | 12.90 | 12.90 | 12.80 | 12.90 | 12.90 | 12.80 | 13.10 | 12.90 |
| 12.90 | 12.90 | 12.80 | 12.90 | 12.90 | 12.80 | 12.90 | 12.90 | 12.90 | 12.80 |
| 12.90 | 12.80 | 12.80 | 13.10 | 12.90 | 12.80 | 13.10 | 12.90 | 12.80 | 12.80 |
| 12.70 | 12.80 | 12.80 | 13.00 | 12.70 | 12.80 | 13.00 | 12.70 | 12.80 | 12.80 |
Process parameters;
| Characteristics | Total clay of green sand |
| Process: | Sand Preparation Process |
| USL | 14 |
| LSL | 12 |
Calculation:
The formula of Pp (Process Performance):
Pp = ((USL-LSL)/ (6 X S))
= (14-12)/ (6 X 0.13) = 2.64.
The Formula of Ppk (Process Performance Index):
Ppk = Minimum of PPU or PPL
PPU= ((USL-Average of average)/ (3 X S))
PPL= ((Average of average-LSL)/ (3 X S))
Ppk= Minimum of PPU or PPL = Min. (3.06, 2.22) = 2.22
Summary of calculation:
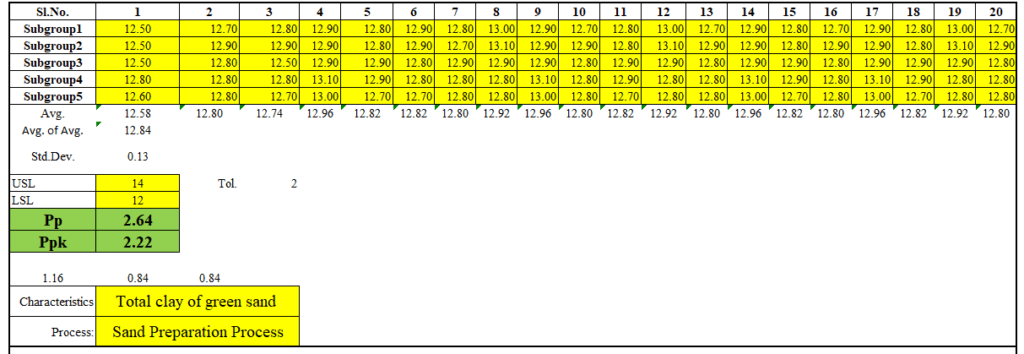
Note: Click here to know more about manual calculation and download the free excel template from the above link.
You can also love to read similar topics;
How to calculate process performance (Pp & Ppk)?
Process Performance (Pp) & Ppk Excel Template |DOWNLOAD
Process Capability Analysis |Cp & Cpk Calculation Excel Sheet with Example
How to calculate Cp and Cpk? |Practical Case Study | Process Capability Example
More on TECHIEQUALITY
Thank you for reading…Keep visiting Techiequality.Com
Popular Post

