How to Calculate Correlation Coefficient (r) | Correlation Coefficient Formula
How to Calculate Correlation Coefficient (r) |Correlation Coefficient Formula
Hi readers! Today we will discuss How to Calculate Correlation Coefficient (r)? Basically coefficient of correlation gives an idea about the nature of the correlation between two variables, i.e. No correlation, positive correlation, and negative correlation. A detailed interpretation of the coefficient of correlation is given in Table-A. We have published three similar articles on correlation analysis and links of the individuals mentioned below. But here we will merely explain the calculation part of the correlation coefficient with an example.
How to do correlation analysis in excel?
Step by step guide of Correlation analysis in Minitab.
Correlation Analysis Examples and its Interpretation.
How to Calculate Correlation Coefficient (r) |Correlation Coefficient Formula:

Let’s consider a manufacturing-related example to calculate the correlation coefficient (r). The process engineer has applied the Forging force in the billet at four different stages, as you can see in the above figure. At every stage, there is a reduction of height per stroke of the billet. The original height of the billet is 140.0mm. The details data for every stage is mentioned in the below table.
| Forging Force in “N” (X) | Reduction of height/Stroke of Billet in “mm” (Y) |
| 500 | 6.2 |
| 750 | 19 |
| 1000 | 29.5 |
| 1250 | 36 |
| 1500 | 39.5 |
From the above data table, we are going to calculate the correlation coefficient (r). And we will verify the manual calculation of the “r” value against the value calculated by Minitab and Excel.
Correlation Coefficient Formula:

Calculation of Correlation Coefficient “r”:
Data table:
| Forging Force in “N” (X) | Reduction of height/Stroke of Billet in “mm” (Y) |
| 500 | 6.2 |
| 750 | 19 |
| 1000 | 29.5 |
| 1250 | 36 |
| 1500 | 39.5 |
The standard deviation of “X”:

| Forging Force in “N” (X) | X² |
| 500 | 250000 |
| 750 | 562500 |
| 1000 | 1000000 |
| 1250 | 1562500 |
| 1500 | 2250000 |
| Σ(X²) = | 5625000 |
| (ΣX) = | 5000 |
| (ΣX)² = | 25000000 |
| (ΣX)²/n = | 5000000 |
| n-1 = | 4 |
| Σ(X²)-(ΣX)²/n = | 625000 |
| [{Σ(X²)-(ΣX)²/n}/(n-1)] = | 156250 |
| Square root of [{Σ(X²)-(ΣX)²/n}/(n-1)] = | 395.2847075 |
The standard deviation of “Y”:

| Reduction of height/Stroke of Billet in “mm” (Y) | Y² |
| 6.2 | 38.44 |
| 19 | 361 |
| 29.5 | 870.25 |
| 36 | 1296 |
| 39.5 | 1560.25 |
| Σ(X²) = | 4125.94 |
| (ΣX) = | 130.2 |
| (ΣX)² = | 16952.04 |
| (ΣX)²/n = | 3390.408 |
| n-1= | 4 |
| Σ(X²)-(ΣX)²/n = | 735.532 |
| [{Σ(X²)-(ΣX)²/n}/(n-1)] = | 183.883 |
| Square root of [{Σ(X²)-(ΣX)²/n}/(n-1)] = | 13.5603466 |
Correlation Coefficient “r”:

| Forging Force in “N” (X) | Reduction of height/Stroke of Billet in “mm” (Y) | X-X̅ | Y-Y̅ | (X-X̅) * (Y-Y̅) |
| 500 | 6.2 | -500 | -19.84 | 9920 |
| 750 | 19 | -250 | -7.04 | 1760 |
| 1000 | 29.5 | 0 | 3.46 | 0 |
| 1250 | 36 | 250 | 9.96 | 2490 |
| 1500 | 39.5 | 500 | 13.46 | 6730 |
| X̅ = 1000 | Y̅ = 26.04 |
| Σ(X-X̅) (Y-Y̅) = | 20900 |
| (Sx) * (Sy) = | 5360.197641 |
| (n-1) *((Sx) * (Sy)) = | 21440.79056 |
| r= | 0.9748 |
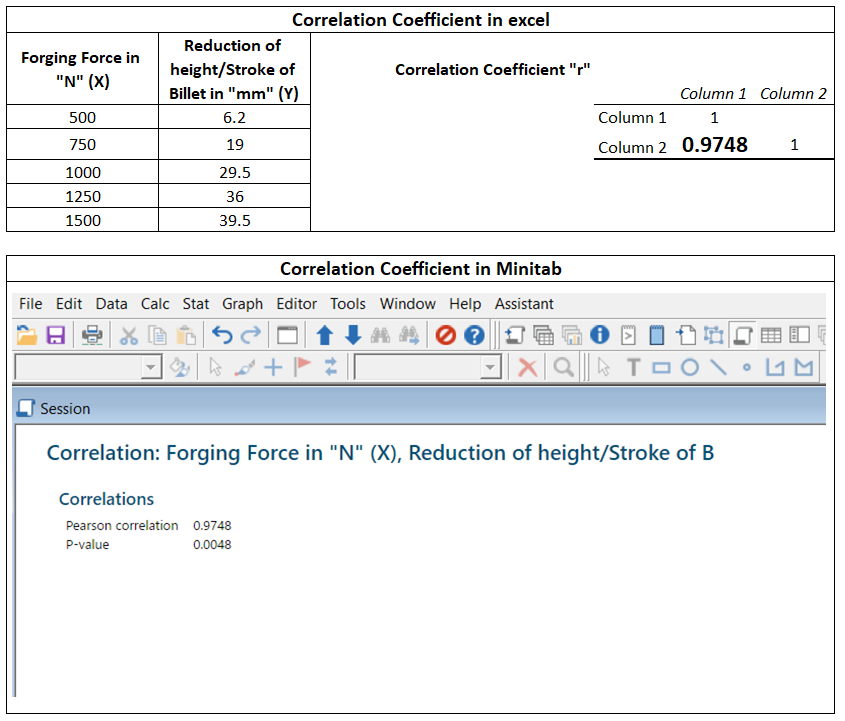
Similarly, we have done the correlation analysis in excel and Minitab and found the value of the Correlation coefficient is 0.9748.
Interpretation of Correlation coefficient (r), Table-A:
| Correlation Coefficient (r ) | Interpretation |
| r=0.5 | Low positive correlation |
| r=0.9 | High positive correlation |
| r=1 | Perfect positive correlation |
| r=0 | No correlation |
| r= -0.5 | Low negative correlation |
| r= -0.9 | High negative correlation |
| r= -1 | Perfect negative correlation |
Summary of the Above Example:
From the above example, we found the value of “r” (Correlation coefficient) 0.975, which means there is a perfect positive correlation between the two variables.
When and How to Apply Correlation Analysis Tool in Manufacturing Industries?
We are always trying to share our own manufacturing experience so that our readers can easily understand, and learn the concept and can apply it in the manufacturing process to solve the problem. we think the calculation part is clear to all and the next, part we’re going to explain is the application of the Correlation tool. Always keep in your mind that correlation analysis can be applicable only between two variables. it’s a very useful tool generally used in industry to resolve the quality-related problems.
let’s say for example, you have 10 no cast iron blocks in the same shape and size, each and every block has a different percentage of “Mn”, but other compositions are the same in all the blocks. All blocks were tested to know the hardness. After getting the result we analyze both the variables by applying the Correlation tool to know whether block hardness is varied w.r.t Mn % or not. it means whether is there any relation between variables or not. Similarly, you can apply this tool between two quality-related factors like cause and effect to know whether significant relation or in-signification relation between cause and effect. so that you take the action plan to fix-up the problem.
Also Read…
How to Plot Scatter Diagram in Excel? |Guides with example | Interpretation
Scatter Diagram Template |Industrial Example |Download Excel Format
Free Templates / Formats of QM: we have published some free templates or formats related to Quality Management with manufacturing / industrial practical examples for better understanding and learning. if you have not yet read these free template articles/posts then, you could visit our “Template/Format” section. Thanks for reading…keep visiting techiequality.com
More on Techiequality

