How to create forecast in excel | Illustration with Example
How to create forecast in excel | Illustration with Example:
Hi Readers! Here we are going to learn today on how to create forecast in excel. We have already published an article on basic knowledge and the selection process for best forecasting methods. As we know that forecasting is one of the common methodologies used in various types of industries for predicting the future based on the results of previous data. Here we will give more focus on the creation or preparation of the forecasting method in excel (note that, given excel process may be different from excel to excel depending on excel’s version).
Suppose a bike showroom owner would like to do the purchasing plan considering the last 4 month’s selling quantity, store constrain, Market demand, festive season, etc. But he could not finalize the quantity. So, here we are going to do the forecast method to finalize the value (this is only the reference method and forecast value, the actual value may vary depending on various factors). Through this example, we shall learn only on how to create forecasts in excel (Some common methods only). We are going to use the excel-2007 version, the process may vary from excel version to version.
Illustration of How to create forecast in excel?
The last 9 months’ bike selling quantity is given below as;
| Month | Bike Selling Quantity | |
| Jan | 1 | 102 |
| Feb | 2 | 104 |
| Mar | 3 | 105 |
| Apr | 4 | 101 |
| May | 5 | 99 |
| Jun | 6 | 89 |
| Jul | 7 | 105 |
| Aug | 8 | 115 |
| Sep | 9 | 103 |
| Oct | 10 | ?? |
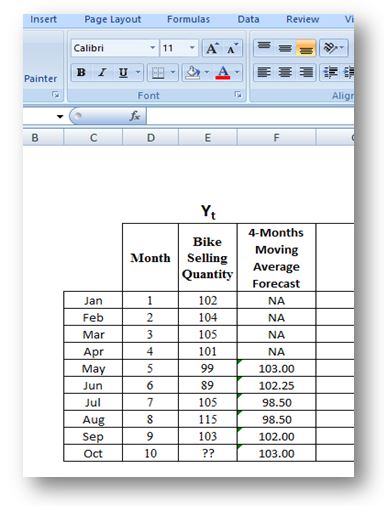
We have calculated a 4-Months Moving Average Forecast.
| Month | Bike Selling Quantity | 4-Months Moving Average Forecast | |
| Jan | 1 | 102 | NA |
| Feb | 2 | 104 | NA |
| Mar | 3 | 105 | NA |
| Apr | 4 | 101 | NA |
| May | 5 | 99 | =average(select top 4 months bike selling quantity) |
| Jun | 6 | 89 | =average(104,105,101,99) |
| Jul | 7 | 105 | |
| Aug | 8 | 115 | |
| Sep | 9 | 103 | |
| Oct | 10 | ?? |
Excel Function = Average (Select data array of 4 months)
In the above table we have mentioned the excel function. Accordingly calculated the 4-months moving average forecast value, the same table is given below. Just try to calculate the value by yourself in excel and verify the same.
| Month | Bike Selling Quantity | 4-Months Moving Average Forecast | |
| Jan | 1 | 102 | NA |
| Feb | 2 | 104 | NA |
| Mar | 3 | 105 | NA |
| Apr | 4 | 101 | NA |
| May | 5 | 99 | 103.00 |
| Jun | 6 | 89 | 102.25 |
| Jul | 7 | 105 | 98.50 |
| Aug | 8 | 115 | 98.50 |
| Sep | 9 | 103 | 102.00 |
| Oct | 10 | ?? | 103.00 |
How to calculate Exponential Smoothening Forecast? By considering the alpha value 0.8
Excel function, ESF of desire month = (0.8*previous month bike selling quantity + 0.2* previous month ESF)
| Month | Bike Selling Quantity | Exponential Smoothening Forecast (factor, alpha=0.8) | |
| Jan | 1 | 102 | NA |
| Feb | 2 | 104 | 102 |
| Mar | 3 | 105 | =(0.8*Bike selling quantity of Feb. month + 0.2*ESF of Feb. month) |
| Apr | 4 | 101 | |
| May | 5 | 99 | |
| Jun | 6 | 89 | |
| Jul | 7 | 105 | |
| Aug | 8 | 115 | |
| Sep | 9 | 103 | |
| Oct | 10 | ?? |
| Month | Bike Selling Quantity | Exponential Smoothening Forecast (factor, alpha=0.8) | |
| Jan | 1 | 102 | NA |
| Feb | 2 | 104 | 102 |
| Mar | 3 | 105 | 104 |
| Apr | 4 | 101 | 105 |
| May | 5 | 99 | 102 |
| Jun | 6 | 89 | 100 |
| Jul | 7 | 105 | 91 |
| Aug | 8 | 115 | 102 |
| Sep | 9 | 103 | 112 |
| Oct | 10 | ?? | 105 |
Linear Regression Forecasting calculation in Excel:
| Month | Bike Selling Quantity | |
| Jan | 1 | 102 |
| Feb | 2 | 104 |
| Mar | 3 | 105 |
| Apr | 4 | 101 |
| May | 5 | 99 |
| Jun | 6 | 89 |
| Jul | 7 | 105 |
| Aug | 8 | 115 |
| Sep | 9 | 103 |
| Oct | 10 | ?? |
Based on the above data “month” & “bike selling quantity” plot the scatter diagram including linear regression function as per below;
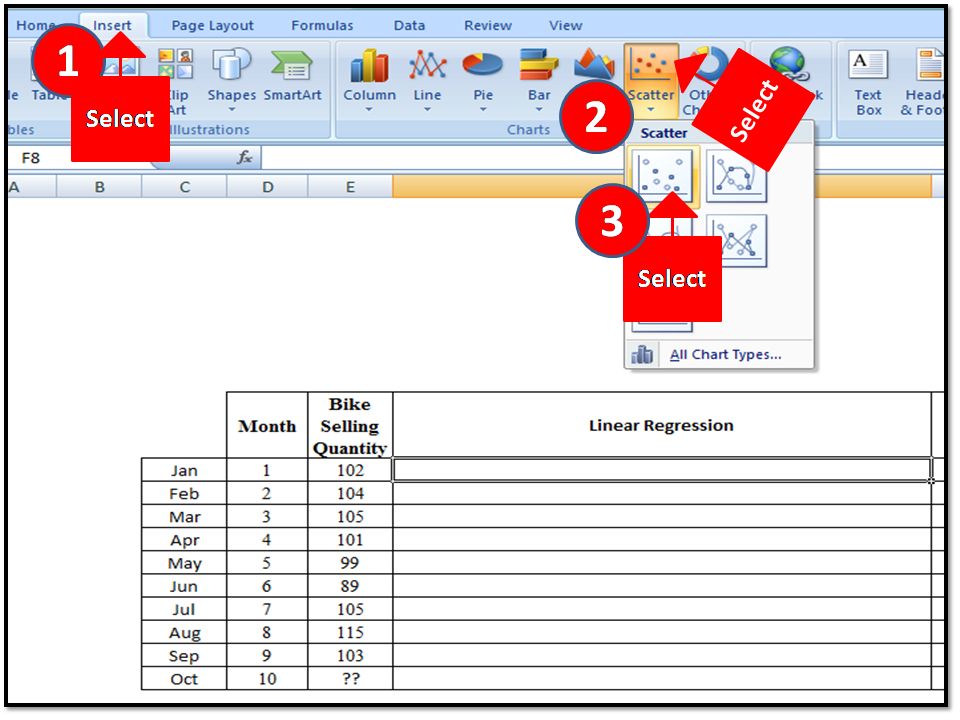

From the Scatter diagram, you can get the function, here y=0.416*X + 100.4
By using the function we have calculated the forecast value which is given in the below table.
| Month | Bike Selling Quantity | Linear Regression | |
| Jan | 1 | 102 | 101 |
| Feb | 2 | 104 | 101 |
| Mar | 3 | 105 | 102 |
| Apr | 4 | 101 | 102 |
| May | 5 | 99 | 102 |
| Jun | 6 | 89 | 103 |
| Jul | 7 | 105 | 103 |
| Aug | 8 | 115 | 104 |
| Sep | 9 | 103 | 104 |
| Oct | 10 | ?? | 105 |
Accordingly, you can calculate the Forecast value using several types of methods. But if you would like to choose or decide the best forecast value among all types then read our previous article.
Free Templates / Formats of QM: we have published some free templates or formats related to Quality Management with manufacturing / industrial practical examples for better understanding and learning. if you have not yet read these free template articles/posts then, you could visit our “Template/Format” section. Thanks for reading…keep visiting techiequality.com
Popular Post
